Coherent (adj.) Every part is carefully considered, clear and logically connected”
Any analysis worthy of the name requires an objective & robust approach, which is then consistently applied in a disciplined fashion. Without the discipline of consistent application, a variety of subjective behavioural biases will influence interpretation and reduce the probability of consistent results.
This short note on trends and trendlines has been written in the hope that it will provide some consistency to the variety of approaches & styles of trendline construction that are frequently on display. The method of analysis described below is simple, consistent and minimises subjective bias. It is drawn from recognised international authorities on technical analysis.
Note that this is not portfolio management. Portfolio management consists of a feedback loop which includes (i) risk budgeting & capital allocation, (ii) trade identification, and (iii) position management. The analysis of trends & trendlines are merely aids in trade identification i.e. the 2nd step in portfolio management.
Very few markets go straight up or straight down.
Most bull markets advance, consolidate, and then advance further until they are exhausted. A bull market will therefore display a series of higher highs and higher lows, while a bear market will display a series of lower highs and lower lows.
“There is no such thing as the trend – there are countless trends, depending on the method we use to determine a trend.
People typically pick a method for determining trend that fits with their current positions and/or view of the market.
All methods of defining trends compare various combinations of historical price points, however
- all trends are historical, none are in the present
- there is no way to determine the current trend, or even define what “current trend” might mean – we can only determine historical trends”.
Ed Seykota http://www.seykota.com/tribe/tsp/trends/index.htm
We know that prices do not move in straight lines. Uptrends typically consist of a series of higher highs (“HH”) & higher lows (“HL”), or vice versa for downtrends (lower highs & lower lows).

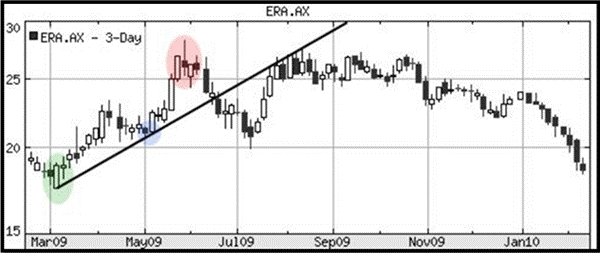
To draw a rising trendline within the period under consideration
- draw a line from the lowest low
- to the highest minor low preceding the highest high
- without violating the price action between the two points
Victor Sperandeo “Trader Vic – Methods of a Wall Street Master”

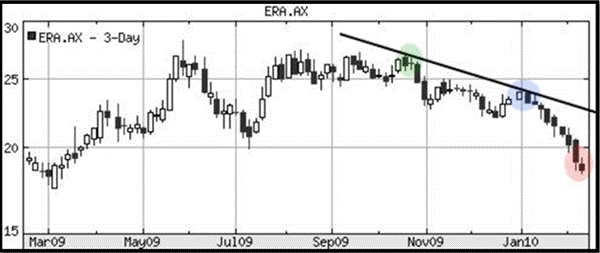
To draw a falling trendline within the period under consideration
- draw a line from the highest high
- to the lowest minor high preceding the lowest low
- without violating the price action between the two points
Victor Sperandeo “Trader Vic – Methods of a Wall Street Master”

This method is consistent, simple and minimises subjective bias.
For more information on the Trends and Trendlines please contact either enquiries@coherentcommodities.com or Wendy Funnell at wendy.funnell@coherentcm.com.
Author: Andy Pfaff
Download a PDF version of this article.

